This is my original article (published May 2021), translated from a Habrahabr. I decided to remove all old articles from it and store it only in my personal blog because I don't like moral position of Habr audience.
Problem Statement
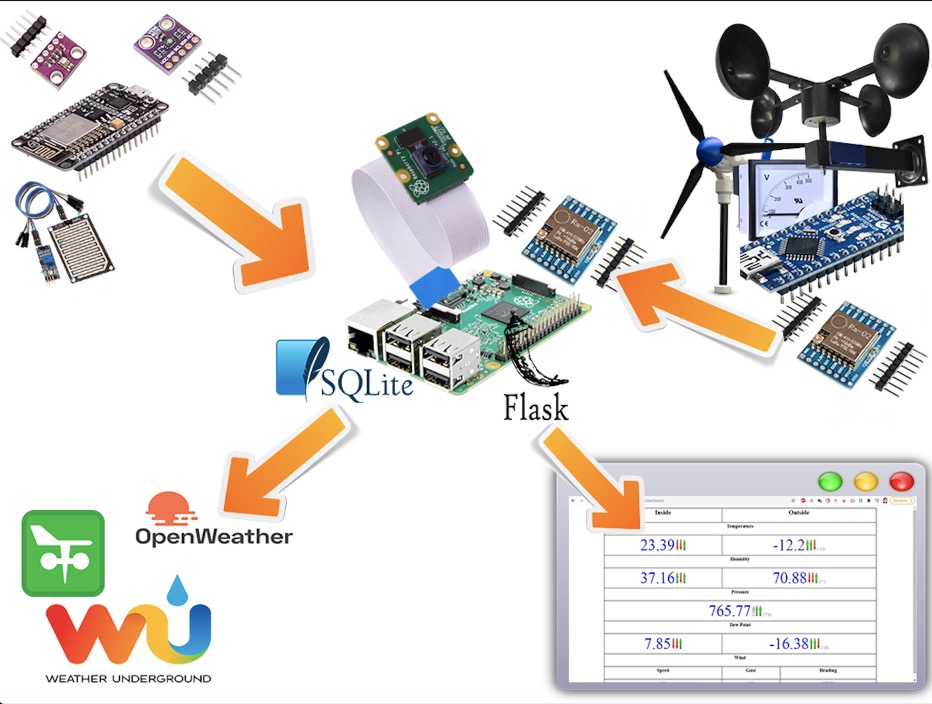
So, why bother with a weather station at all? Sure, there are more weather apps and services today than anyone could ever need, complete with local forecasts down to the meter. But apart from checking the outdoor conditions, I need real-time data from temperature and humidity sensors inside my own space. And I’m not just gathering this data for fun. Knowing the indoor and outdoor temperatures means I can control things like the boiler or ventilation system, automating a comfortable indoor climate without lifting a finger—weather-responsive automation at its finest.
On top of that, I want to track weather trends over longer time periods, like one or two years. Meaning, this data needs a place to live—a proper, dedicated storage solution.
From all this, let’s lay down the key requirements:
- Data Storage: We’ll need a server to hoard all the precious data.
- Sensor Variety and Modularity: Sensors in different locations, doing different things, so let’s keep it modular (hello, IoT).
- Cloud Sync: Besides local storage, it’d be nice to throw at least the current readings into the cloud.
- Data Sharing: We’ll end up with a solid dataset, so why not make it shareable?
Ready? Let's dive into the fun stuff.
Architecture
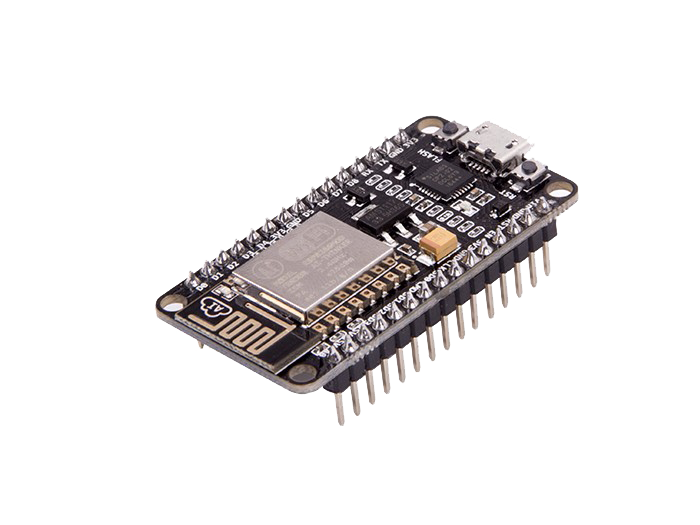
The simplest and most popular setup for a weather station is often Arduino. But getting it to play nice with a home network? That’s going to need additional shields and adapters, meaning extra cash and extra hassle—i.e., wasted time. So instead, I’m going for something with Wi-Fi baked right in: the ESP8266 (NodeMCU) module, paired with various sensors. This little powerhouse works just as well indoors as it does outdoors and can even act as a server if you’re feeling adventurous.
But why stop there? Let’s get some real muscle at the center. Luckily, I’ve got a dust-covered, first-gen Raspberry Pi lying around (though any version would work). The indoor sensors could connect directly to the Pi’s GPIO, but here’s the catch: my Pi and router are conveniently set up in one room, but I need monitoring in another. If you don’t have this setup challenge, congrats—you can cut down on one NodeMCU. For the rest of us, the Pi will receive data from the sensors, store it in a database, and display it on demand. Plus, the Pi can be outfitted with a LoRa receiver, letting it pull data from out-of-range sensors (perfect for those Arduinos). Finally, the Pi will ship all the data to the cloud.
Parts List
Here’s what we’ll need to assemble this dream team:
- Raspberry Pi
- ESP8266 (2 units, +1 optional)
- BME280 (2 units) for temperature, humidity, and pressure
- Real-Time Clock DS1302 (optional)
- 128x64 OLED Display with SH1106 controller (optional)
- Rain Sensor with LM373 comparator (optional)
- UV Sensor GY-VEML6070 (optional)
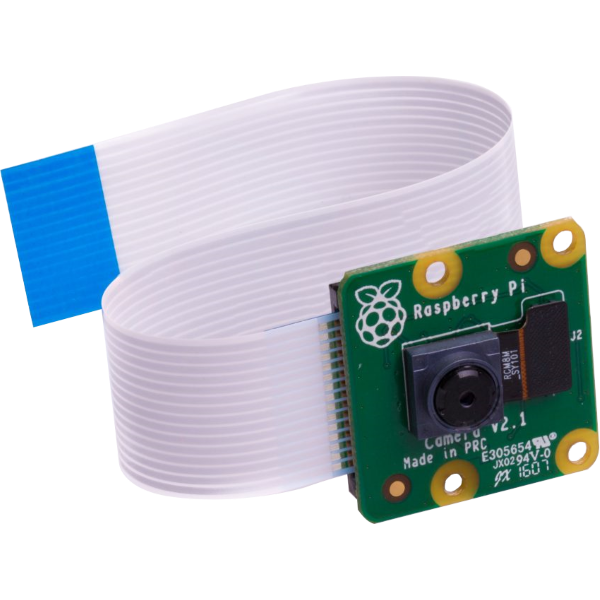
- Raspberry Pi Camera (optional)
- Arduino Nano (2 units, optional)
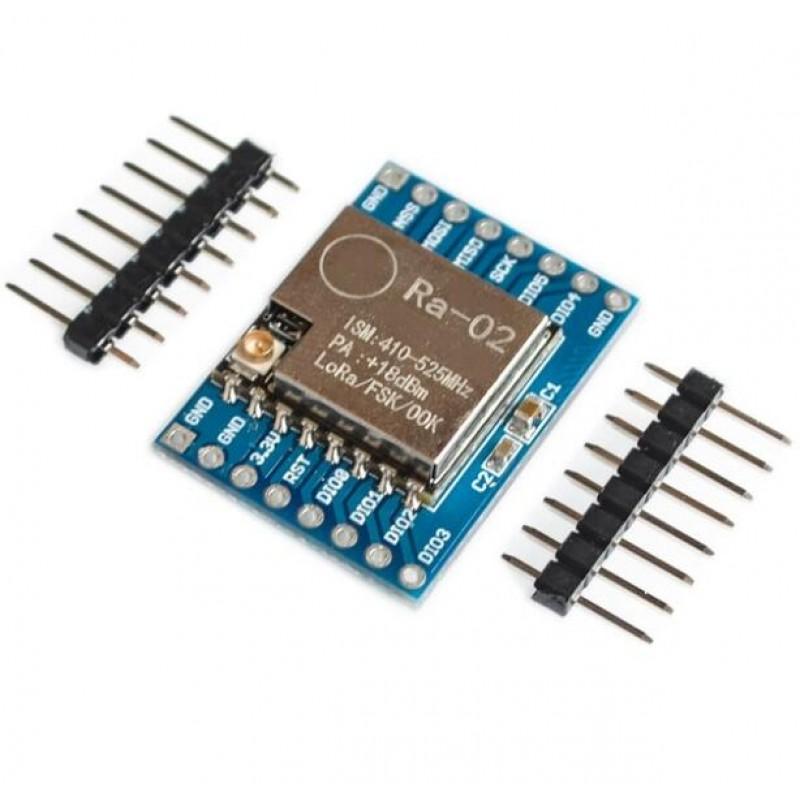
- SX1278 LoRa module (3 units, optional)
- Magnetic Compass with QMC5883L or HMC5883L chip (optional)
- Ambient Light Sensor with LM737 comparator (optional)
- Voltage Sensors up to 25V (optional)
- Current Sensors ACS712 (optional)
With all this in hand, we’re ready to construct a networked weather-tracking beast.
Connecting the SX1278 to the Raspberry Pi
First, let’s wire up the radio module to the Raspberry Pi.
Pin Connections
| Raspberry Pi Pin | SX1278 Pin |
|---|---|
| 3.3V | 3.3V |
| GROUND | GROUND |
| GPIO10 | MOSI |
| GPIO9 | MISO |
| GPIO11 | SCK |
| GPIO8 | NSS/ENABLE |
| GPIO4 | DIO0 |
| GPIO22 | RST |
Connect the pins on your Raspberry Pi to the SX1278 as shown in the diagram.
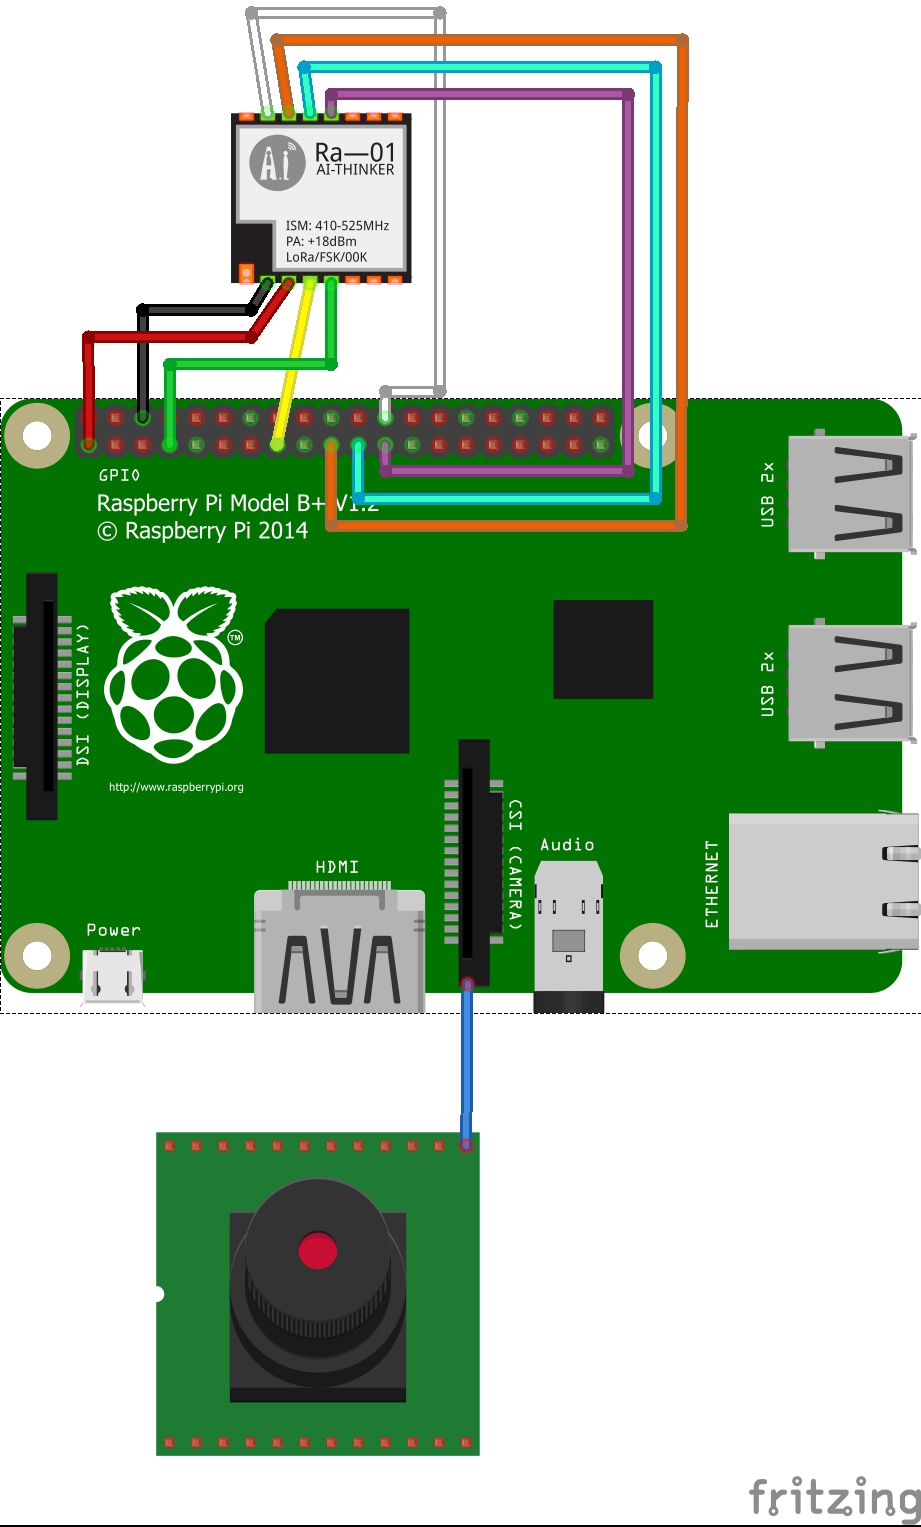
Different Raspberry Pi revisions can have varying pin layouts, so check the documentation to confirm which pins to use.
A Few Warnings for LoRa Module Setup
Before powering up the LoRa module, make sure an antenna is attached. Neglect this and you could end up with a nice, expensive paperweight if the module burns out.
Signal quality depends not just on the antenna but on correct configurations. Pay attention to matching the frequencies of the transmitter and receiver and keep the frequency range clear of noise (think of it like avoiding the traffic jam caused by kids’ RC cars on the same band).
Setting up the Server
Load Raspberry Pi OS Lite onto your Raspberry Pi.
Next, let’s set a static IP address:
sudo nano /etc/dhcpcd.conf
Add or edit the lines to set your desired IP address and router IP:
interface eth0  # or wlan0 if you’re connecting via Wi-Fi
static ip_address=192.168.0.4/24
static routers=192.168.0.1
static domain_name_servers=192.168.0.1 8.8.8.8
Now, let’s enable remote access options via SSH, SPI (for LoRa), and the Camera module if we’ll be using it:
sudo raspi-config
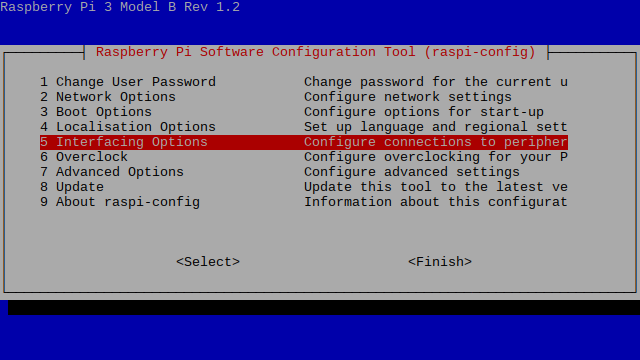
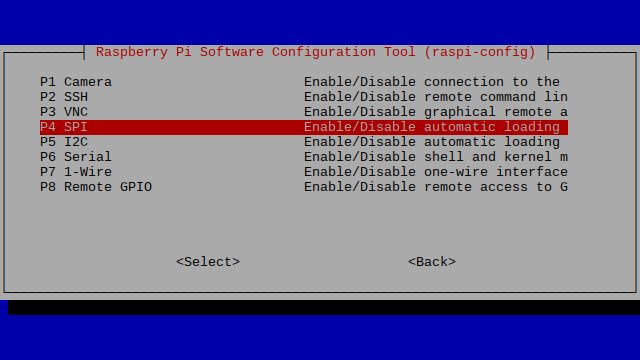
Enable:
- SSH (for remote access, unless you’re working with a keyboard attached)
- SPI (if using LoRa)
- Camera (if using the camera)
Make sure auto-login is set:
- Navigate to Boot Options -> Console Autologin
Exit raspi-config, then reboot:
sudo shutdown -r now
With remote access ready, we can connect to the Pi via SSH or keep working with the keyboard.
Since all server logic is written in Python3, install it:
sudo apt-get install python3.12
Now download the project H.O.M.E.:
cd ~
git clone https://github.com/wwakabobik/home.git
I’ve chosen Flask as the web server—there’s an excellent articles by Miguel Grinberg, so I won’t go into the details.
Copy the server content to a new directory:
mkdir web-server
cp -r home/home_server/* /home/pi/web-server/
Install dependencies:
cd web-server
sudo python3.7 -m pip install -r requirements.txt
Create the database from the schema template:
cat db/schema.sql | sqlite3 flask_db
Everything’s ready! Launch the server:
cd /home/pi/web-server && sudo python3.7 app.py
If you want the server to start on boot, add a script call to /etc/rc.local just before exit 0:
/home/pi/flask_startup.sh &
Copy this startup script into place:
cd ~
cp ~/home/bash/flask_startup.sh .
For added reliability, set up a watchdog script to monitor the server’s status and restart it if it’s down. Copy the health check script:
cp ~/home/bash/check_health.sh .
Add it to cron:
sudo crontab -e
with the following task:
1-59/5 * * * * /home/pi/check_health.sh
Server Software Overview
The main server file is app.py:
#!/usr/bin/env python3.12

from multiprocessing.pool import ThreadPool
from flask import Flask
from db.db import init_app
from lora_receiver import run_lora

app = Flask(__name__, template_folder='templates')

# import all routes
import routes.api
import routes.pages
import routes.single_page

if __name__ == '__main__':
    # Start LoRa receiver as subprocess
    pool = ThreadPool(processes=1)
    pool.apply_async(run_lora)
    # Start Flask server
    init_app(app)
    app.run(debug=True, host='0.0.0.0', port='80')
    # Teardown
    pool.terminate()
    pool.join()
In addition to launching the server, this script starts the LoRa receiver as a subprocess to gather sensor data and forward it to the server.
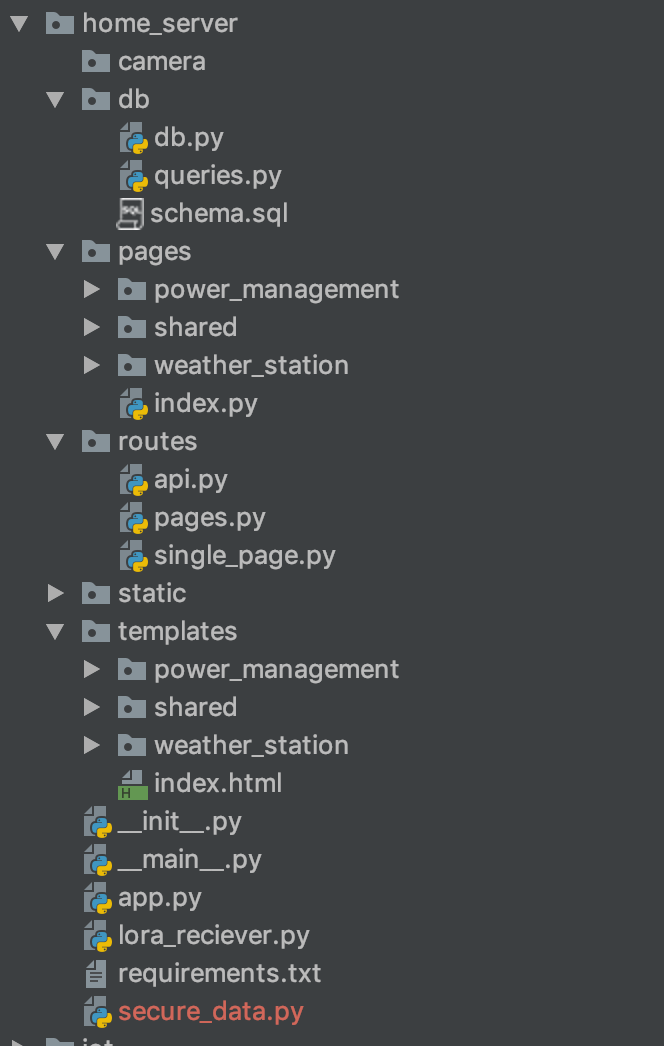
The rest of the architecture is classic Flask. All routes are organized into separate files, static content (like images) is in static, templates are in templates, and database logic is stored in db. Any camera images will be stored in camera.
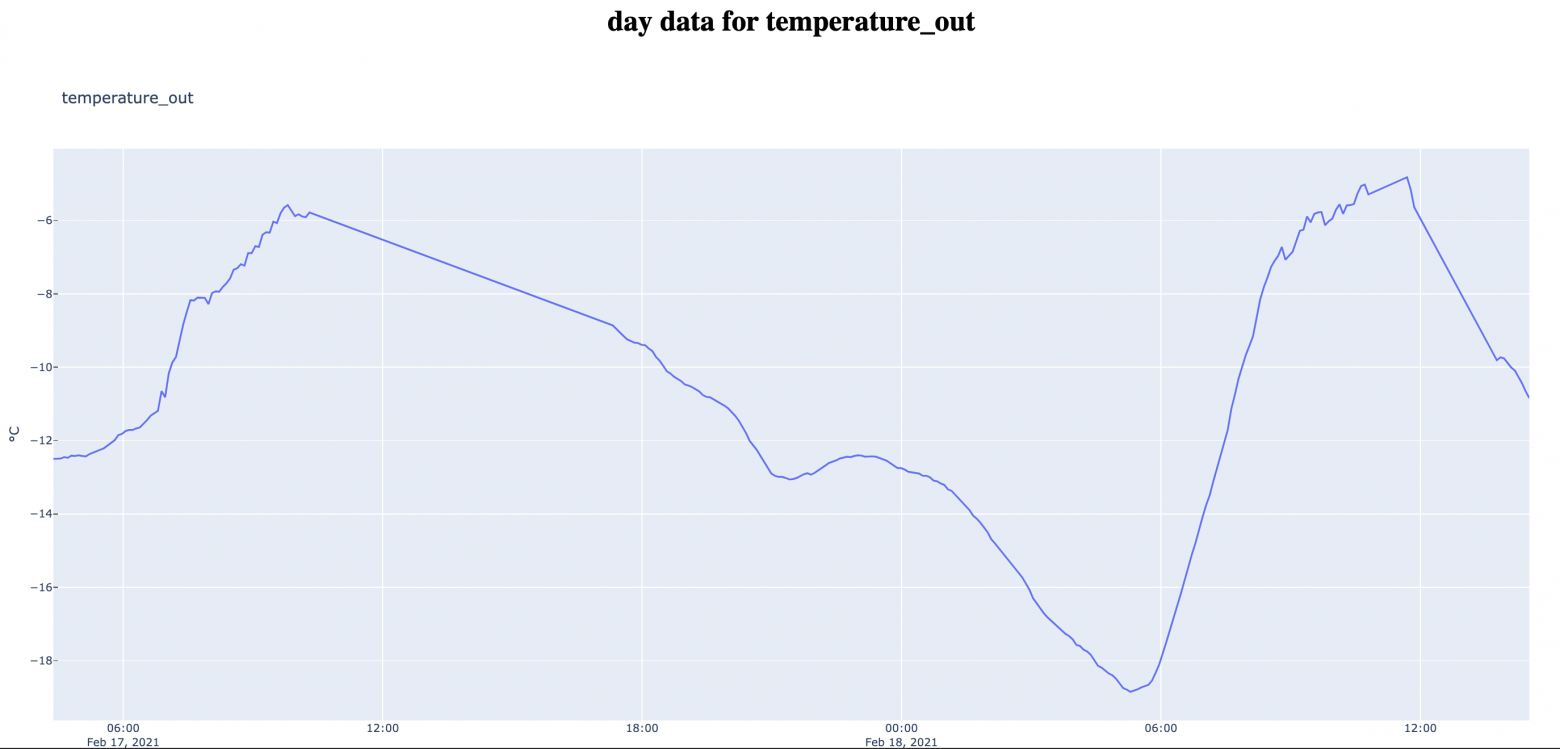
Finally, current readings can be viewed on the dashboard pages, while graphs and data (rendered with Plotly) are available on separate pages.
LoRa Receiver Software
The LoRa receiver's logic is implemented in home_server/lora_receiver.py.
from time import sleep
import requests
from SX127x.LoRa import *
from SX127x.board_config import BOARD

endpoint = "http://0.0.0.0:80/api/v1"

class LoRaRcvCont(LoRa):
    def __init__(self, verbose=False):
        super(LoRaRcvCont, self).__init__(verbose)
        self.set_mode(MODE.SLEEP)
        self.set_dio_mapping([0] * 6)

    def start(self):
        self.reset_ptr_rx()
        self.set_mode(MODE.RXCONT)
        while True:
            sleep(.5)
            rssi_value = self.get_rssi_value()
            status = self.get_modem_status()
            sys.stdout.flush()

    def on_rx_done(self):
        self.clear_irq_flags(RxDone=1)
        payload = self.read_payload(nocheck=True)
        formatted_payload = bytes(payload).decode("utf-8", 'ignore')
        status = self.send_to_home(formatted_payload)
        if status:
            sleep(1)  # got data, let’s nap to skip repeats
        self.set_mode(MODE.SLEEP)
        self.reset_ptr_rx()
        self.set_mode(MODE.RXCONT)

    def send_to_home(self, payload):
        if str(payload[:2]) == '0,':
            requests.post(url=f'{endpoint}/add_wind_data', json={'data': payload})
        elif str(payload[:2]) == '1,':
            requests.post(url=f'{endpoint}/add_power_data', json={'data': payload})
        else:
            print("Garbage collected, ignoring")  # debug
            status = 1
        return status

def run_lora():
    BOARD.setup()
    lora = LoRaRcvCont(verbose=False)
    lora.set_mode(MODE.STDBY)
    lora.set_pa_config(pa_select=1)
    assert (lora.get_agc_auto_on() == 1)

    try:
        lora.start()
    finally:
        lora.set_mode(MODE.SLEEP)
        BOARD.teardown()
Here, the main event is in on_rx_done, where we receive and decode packets. In send_to_home, if the first two characters of payload match our sensor code ("0," for wind data or "1," for power data), it’s sent to the server, and we sleep to skip repeated packets.
API
The server spends 99% of its time just idling, but for that precious 1%, it handles incoming and outgoing data via an API.
Using Flask’s REST API, we’ll receive and send data from sensors.
home_server/routes/api.py
@app.route('/api/v1/send_data')
def send_weather_data():
    return send_data()

@app.route('/api/v1/add_weather_data', methods=['POST'])
def store_weather_data():
    if not request.json:
        abort(400)
    timestamp = str(datetime.now())
    unix_timestamp = int(time())
    data = request.json.get('data', "")
    db_data = f'"{timestamp}", {unix_timestamp}, {data}'
    store_weather_data(db_data)
    return jsonify({'data': db_data}), 201
Data is writing to log.
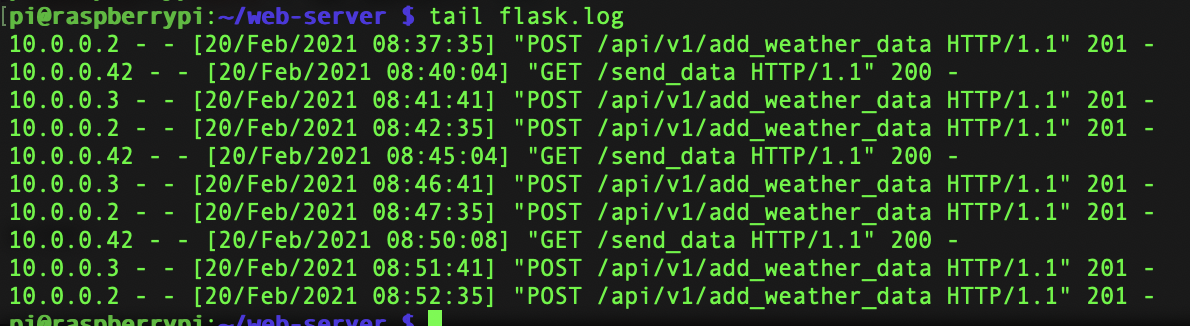
In our case, receiving sensor data involves handling a POST request containing JSON, which we then store in the database. On a GET request (via send_data), we send data to the cloud.
home_server/pages/weather_station/send_data.py
def send_data():
    data = get_last_measurement_pack('0', '1')
    image = take_photo()
    wu_data = prepare_wu_format(data=data)
    response = str(send_data_to_wu(wu_data))
    response += str(send_data_to_pwsw(wu_data))
    response += str(send_data_to_ow(data))
    response += str(send_data_to_nardmon(data))
    send_image_to_wu(image)
    copyfile(image, f'{getcwd()}/camera/image.jpg')
    return response
Ah yes, the camera. If we have a camera attached to the Raspberry Pi, we can also send or save images of the weather outside. The function below handles that.
home_server/pages/shared/tools.py
from picamera import PiCamera
<...>
camera = PiCamera()
<...>

def take_photo():
    camera.resolution = (1280, 720)  # lower resolution to fit in limits
    camera.start_preview()
    sleep(5)
    image = f'{getcwd()}/camera/image_{int(time())}.jpg'
    camera.capture(image)
    camera.stop_preview()
    return image
External Sensors
Full sketches can be found in home/iot.
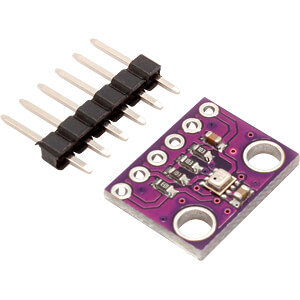
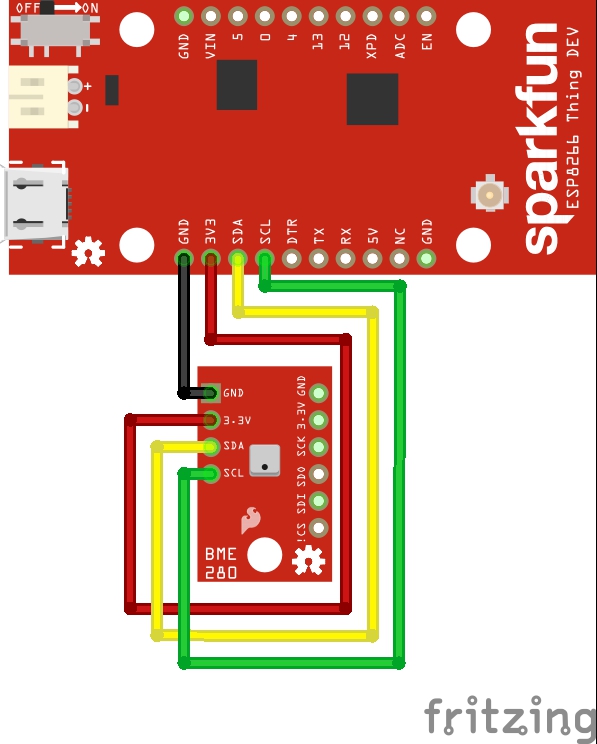
The most convenient and straightforward module for a DIY weather station is the BME280 — a neat little combo of thermometer, hygrometer, and barometer. We hook it up to the ESP8266 via I2C:
Flashing will be done using the Arduino IDE (how to add ESP8266 support is described, for instance, in this Habr article).
iot/esp8266/weatherstation_in/weatherstation_in.ino
#include <ESP8266WiFi.h>
#include <ESP8266HTTPClient.h>
#include <Wire.h>
#include <SPI.h>
#include <Adafruit_BME280.h>
#include <Arduino_JSON.h>

Adafruit_BME280 bme; // use I2C interface
Adafruit_Sensor *bme_temp = bme.getTemperatureSensor();
Adafruit_Sensor *bme_pressure = bme.getPressureSensor();
Adafruit_Sensor *bme_humidity = bme.getHumiditySensor();

// Датчик не сказать, чтобы очень точный, поэтому добавляем корректирующие значения
float correction_temperature = -0.5;
float correction_pressure = 15;
float correction_humidity = 10;

// подключаем Wifi
void connect_to_WiFi()
{
   WiFi.mode(WIFI_STA);
   WiFi.begin(wifi_ssid, wifi_password);
   while (WiFi.status() != WL_CONNECTED)
   {
      delay(500);
   }
   Serial.println("WiFi connected");
   Serial.print("IP address: ");
   Serial.println(WiFi.localIP());
   #endif

}

/* <…> */

// собираем данные с датчиков

float get_temperature()
{
    sensors_event_t temp_event, pressure_event, humidity_event;
    bme_temp->getEvent(&temp_event);
    return temp_event.temperature + correction_temperature;

}

/* <…> */

// также точку росы можно вычислить до отправки на сервер, делаем это:
float get_dew_point()

{
    float dew_point;
    float temp = get_temperature();
    float humi = get_humidity();
    dew_point =  (temp - (14.55 + 0.114 * temp) * (1 - (0.01 * humi)) - pow(((2.5 + 0.007 * temp) * (1 - (0.01 * humi))),3) - (15.9 + 0.117 * temp) * pow((1 - (0.01 * humi)), 14));
    return dew_point;
}

/* <…> */

// Форматируем в строку
String get_csv_data()
{
    String ret_string = DEVICE_ID;
    ret_string += delimiter + String(get_temperature());
    ret_string += delimiter + String(get_humidity());
    ret_string += delimiter + String(get_pressure());
    ret_string += delimiter + String(get_dew_point());
    return ret_string;
}

// Отправляем через HTTP, упаковав строку в JSON:
void post_data()
{
    check_connection();
    HTTPClient http;    //Declare object of class HTTPClient
    String content = get_csv_data();
    int http_code = 404;
    int retries = 0;
    while (http_code != 201)
    {
        http.begin(api_url); // connect to request destination
        http.addHeader("Content-Type", "application/json");        // set content-type header
        http_code = http.POST("{\"data\": \"" + content +"\"}");   // send the request
        http.end();                                                // close connection
        retries++;
        if (retries > max_retries)
        {
            Serial.println("Package lost!");
            break;
        }
    }
}

// cобственно, повторяем это время от времени:
void loop()
{
    post_data();
    delay(cooldown);
}
By default, the polling interval is set to 5 minutes. I treat DEVICE_ID = "0" as the indoor sensor and DEVICE_ID = "1" as the outdoor one. Works well enough.
Rain Sensor LM393 + YL-83
You can also add an ultraviolet sensor (e.g., GY-VEML6070) and a rain sensor (based on an LM393 comparator) to the outdoor node. The YL-83 is more of a toy than a serious tool when it comes to actual precipitation levels (especially without calibration), but it does the job — at least if your only concern is “is it raining?” versus “is it dry?”. Which, in my case, it is.
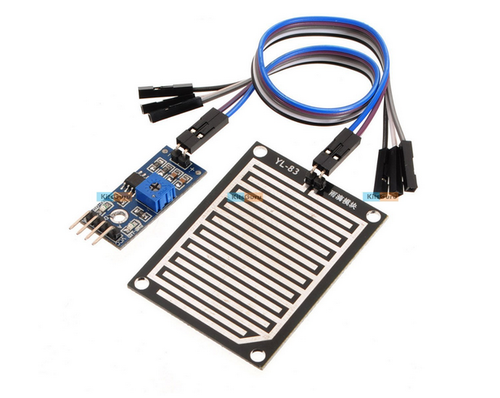
Optionally, you could use an analog UV sensor like the GY-8511, but note that NodeMCU has only one analog input. So it’s either UV or rain — pick your poison. The UV sensor is nice to have for things like solar panel efficiency estimates or simply knowing when it's sunscreen o’clock while mowing the lawn.
Here’s the wiring diagram for ESP8266:
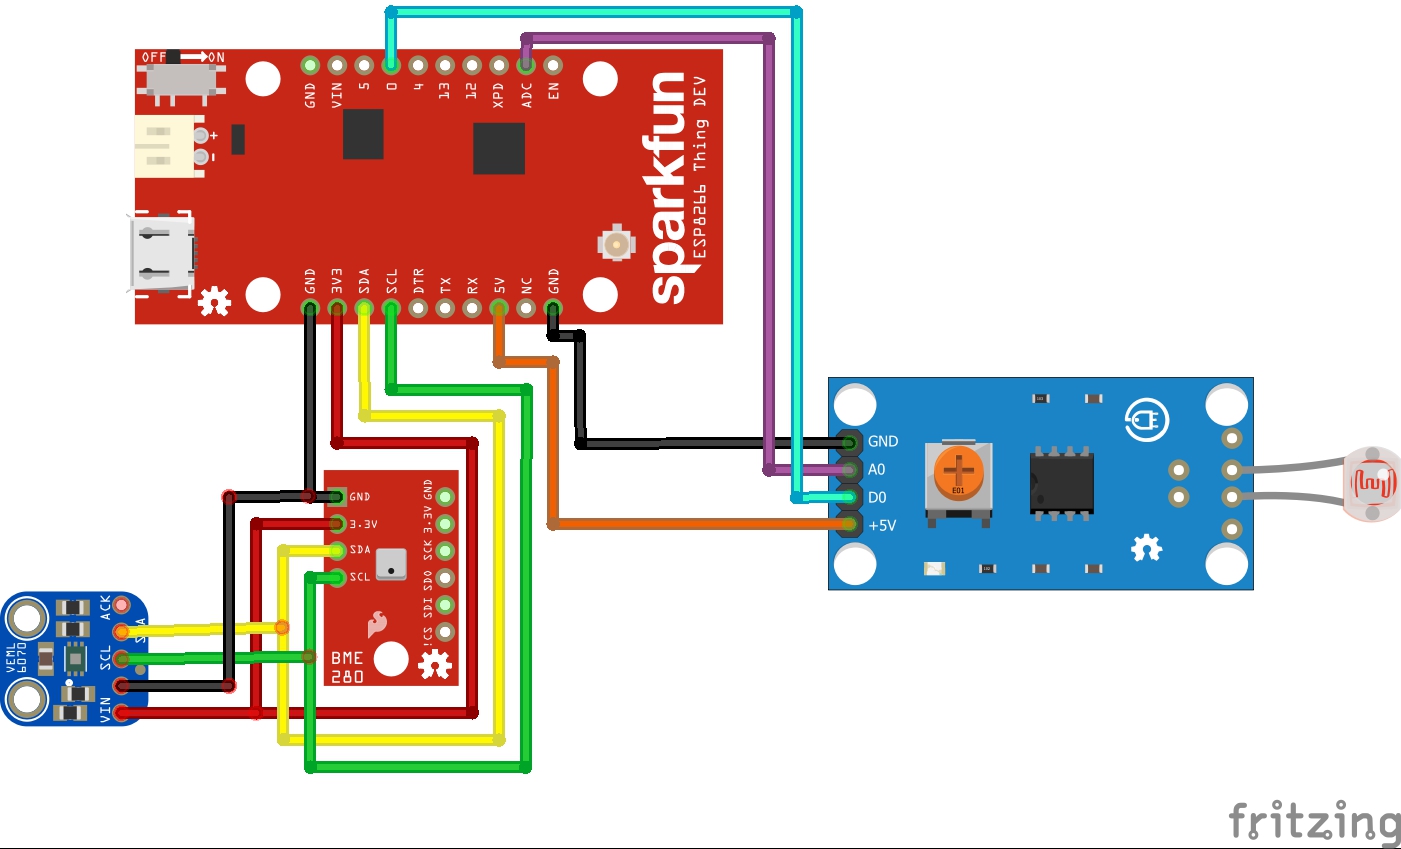
We’ll add three corresponding functions to this sketch:
iot/esp8266/weatherstation_out/weatherstation_out.ino
#include "Adafruit_VEML6070.h"

Adafruit_VEML6070 uv = Adafruit_VEML6070();
#define VEML6070_ADDR_L     (0x38) ///< Low address
RAIN_SENSOR_PIN = A0;

/* <...> */

#ifdef UV_ANALOG_SENSOR
void get_uv_level()
{
    int uv_level = averageAnalogRead(UV_PIN);
    float uv_intensity = mapfloat(uv_level, 0.99, 2.8, 0.0, 15.0);
    return uv_intensity;
}
#endif

#ifdef UV_I2C_SENSOR
void get_uv_level()
{
        return uv.readUV();
}
#endif

#ifdef RAIN_SENSOR
void get_rain_level()
{
    int rain_level = averageAnalogRead(RAIN_SENSOR_PIN);
    return rain_level;
}
#endif
NodeMCU is quite convenient — provided there's decent Wi-Fi signal in range. Sure, slapping weather sensors right on your front porch isn’t exactly pro-tier meteorology, but a properly placed unit a few meters from the house works great. The router signal usually has no problem reaching that far.
Sensor Installation Guidelines
- Temperature and humidity sensors must be mounted over natural ground (grass, soil). No asphalt, concrete, gravel, rock, or metal surfaces allowed.
- They should be installed at a height of 2 meters above the ground, inside a Stevenson screen — a small wooden or plastic box (roughly 40x40x40 cm), with white louvered or perforated walls, and a sunlight- and precipitation-resistant cover. The lid should be sealed and sloped to allow water runoff.
- Wind sensors must be mounted at 10–12 meters above the ground — and yes, that’s ground, not your roof. In a pinch, they can go on top of a one-story building if they rise 2–3 meters above the roof and still meet the 10–12 meter height requirement relative to ground level.
- In the worst-case scenario (high error probability, especially at night), the temperature/humidity sensor can be placed on the shaded side of a building, 2 meters up, with a 3-meter-long mounting rod extending over grass (not pavement!). Never install them near heat sources like walls or rooftops.
- The barometric pressure sensor goes indoors, away from windows and heating appliances. Since pressure readings depend on altitude, the sensor must be calibrated before use. Compare it to a reference barometer or use readings from the nearest official weather station, adjusted for elevation difference (every 10 meters up = ~1 mmHg or ~1.3 hPa drop).
Bonus Device: Display Unit
As a little side project, I added another ESP8266-based unit just to display weather station data. It’s more elegant to have a separate display somewhere convenient, rather than tethering it directly to the indoor sensor.
To make it slightly more useful, I also added a real-time clock module.
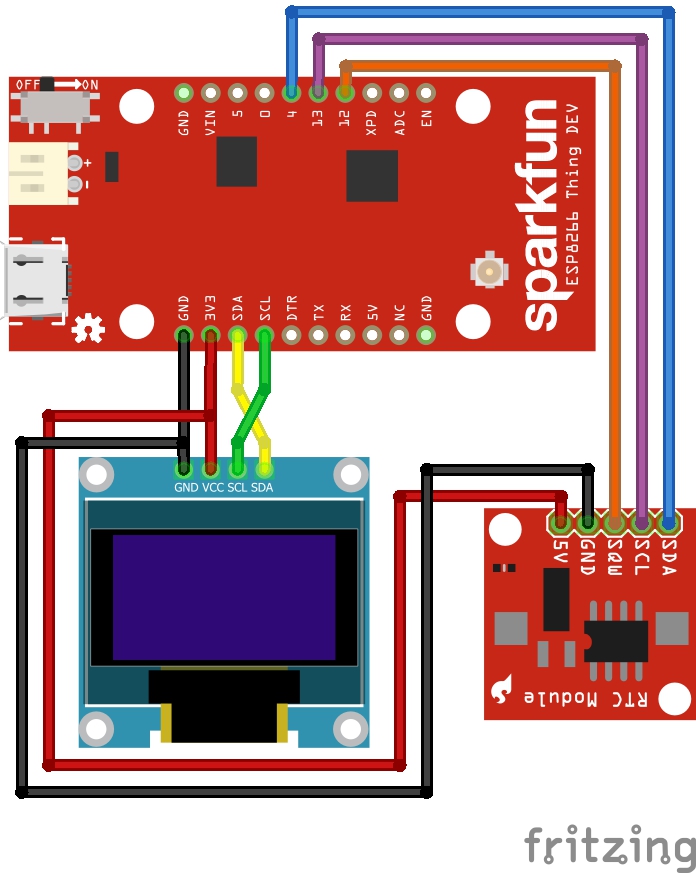
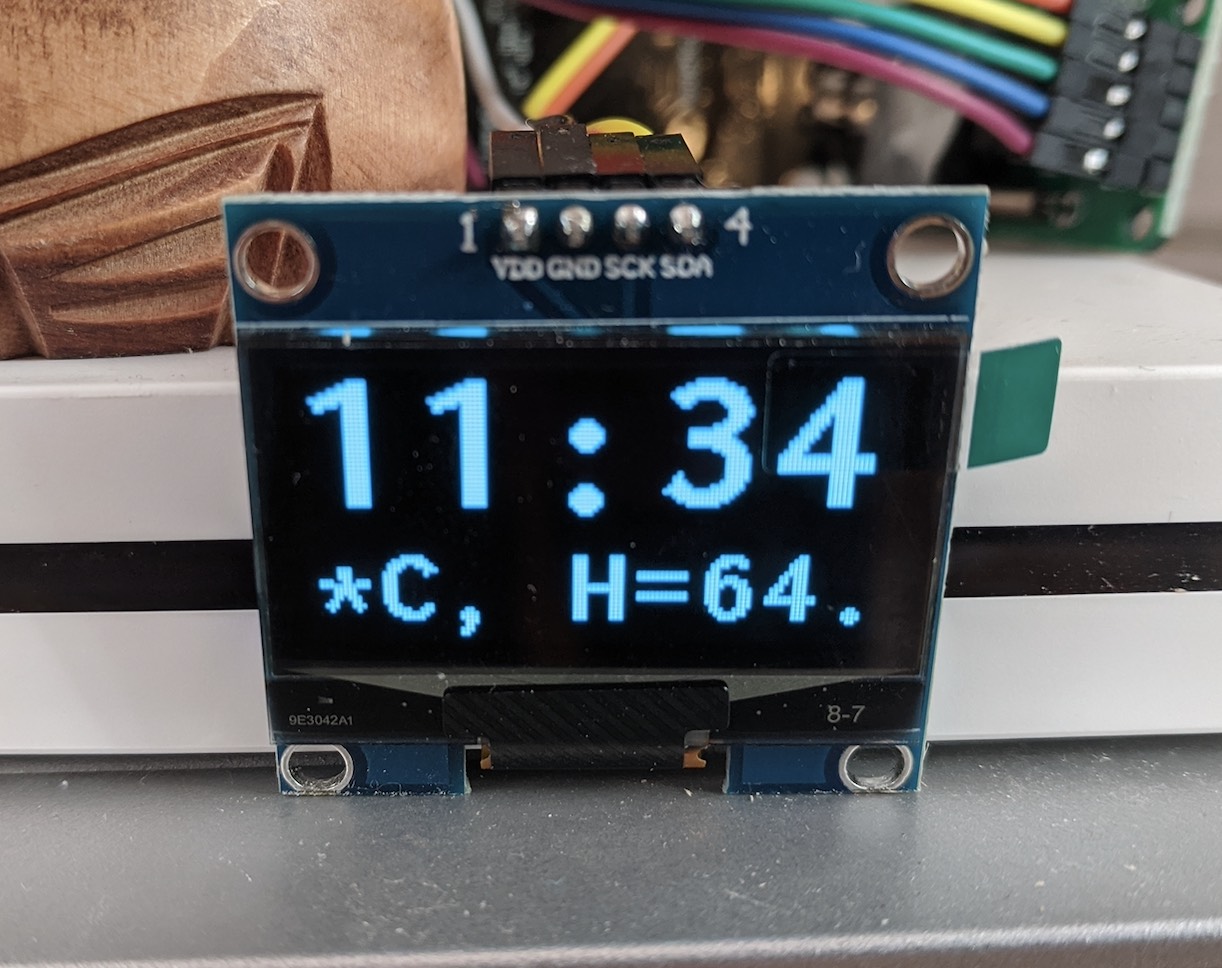
The sketch for the display unit shows the current time (HH:MM) and scrolls the latest weather station data across the screen:
iot/informer/esp8266/informer/informer.ino
#include <ESP8266WiFi.h>
#include <ESP8266HTTPClient.h>
#include <Wire.h>
#include <U8g2lib.h>
#include <virtuabotixRTC.h>  // https://ampermarket.kz/files/rtc_virtualbotix.zip


// RTC
virtuabotixRTC myRTC(14, 12, 13);


// OLED
U8G2_SH1106_128X64_NONAME_F_HW_I2C u8g2(U8G2_R0);
u8g2_uint_t offset;            // current offset for the scrolling text
u8g2_uint_t width;             // pixel width of the scrolling text (must be lesser than 128 unless U8G2_16BIT is defined
const int string_length = 80;  // maximum count of symbols in marquee
char text[string_length];      // text buffer to scroll

// Wi-Fi
const char* wifi_ssid = "YOUR_SSID";
const char* wifi_password = "YOUR_PASSWORD";

// API
const String ip_address = "YOUR_IP_OF_SERVER";
const String port = "YOUR_PORT";
const String api_endpoint = "/api/v1/add_weather_data";
const String api_url = "http://" + ip_address + ":" + port + api_endpoint;
const int max_retries = 5;  // number of retries to send packet

// Timers and delays
const long data_retrieve_delay = 300000;
const int cycle_delay = 5;
unsigned long last_measurement = 0;


void setup(void)
{
    Serial.begin(9600);
    init_OLED();
    init_RTC();
}


/* Init functions */
void init_OLED()
{
    u8g2.begin();
    u8g2.setFont(u8g2_font_inb30_mr); // set the target font to calculate the pixel width
    u8g2.setFontMode(0);              // enable transparent mode, which is faster
}


void init_RTC()
{
    // seconds, minutes, hours, day of the week, day of the month, month, year
    // раскомментируйте при прошивке, заполнив текущую дату и время, затем снова закомментируйте и прошейте ещё раз
    //myRTC.setDS1302Time(30, 03, 22, 5, 19, 2, 2021); // set RTC time
    myRTC.updateTime(); // update of variables for time or accessing the individual elements.
}


""" <...> """


String get_data()
{
    check_connection();

    #ifdef DEBUG
    Serial.println("Obtaining data from server");
    #endif
    HTTPClient http;    //Declare object of class HTTPClient

    int http_code = 404;
    int retries = 0;
    String payload = "Data retrieve error";
    while (http_code != 200)
    {
        http.begin(api_url);                // connect to request destination
        http_code = http.GET();             // send the request
        String answer = http.getString();   // get response payload
        http.end();                         // close connection

        retries++;
        if (retries > max_retries)
        {
            break;
            #ifdef DEBUG
            Serial.println("Couldn't get the data!");
            #endif
        }

        if (http_code == 200)
        {
            payload = answer;
        }
    }
    return payload;
}


void loop(void)
{
    // Check that new data is needed to be retrieved from server
    if (((millis() - last_measurement) > data_retrieve_delay) or last_measurement == 0)
    {
        String stext = get_data();
        stext.toCharArray(text, string_length);
        last_measurement = millis();
        width = u8g2.getUTF8Width(text);    // calculate the pixel width of the text
        offset = 0;
    }

    // Update RTC
    myRTC.updateTime();

    // Now update OLED
    u8g2_uint_t x;
    u8g2.firstPage();
    do
    {
        // draw the scrolling text at current offset
        x = offset;
        u8g2.setFont(u8g2_font_inb16_mr);       // set the target font
        do
        {                                       // repeated drawing of the scrolling text...
            u8g2.drawUTF8(x, 58, text);         // draw the scrolling text
            x += width;                         // add the pixel width of the scrolling text
        } while (x < u8g2.getDisplayWidth());   // draw again until the complete display is filled

        u8g2.setFont(u8g2_font_inb30_mr);       // choose big font for clock
        u8g2.setCursor(0, 30);                  // set position of clock
        char buf[8];                            // init bufer to formatted string
        sprintf_P(buf, PSTR("%02d:%02d"), myRTC.hours, myRTC.minutes); // format clock with leading zeros
        u8g2.print(buf);                        // display clock
    } while (u8g2.nextPage());

    offset-=2;                       // scroll by two pixels
    if ((u8g2_uint_t)offset < ((u8g2_uint_t) - width))
    {
        offset = 0;                  // start over again
    }
    delay(cycle_delay);              // do some small delay
}
The result looks like this:
And on the Raspberry Pi side:
home_server/routes/api.py
@app.route('/api/v1/get_weather_data', methods=['GET'])
def store_wind_data():
    return send_data_to_informer()
pages/weather_station/send_data.py
def send_data_to_informer():
data_in = get_last_measurement_pack('weather_data', '0', '0')
data_out = get_last_measurement_pack('weather_data', '0', '1')
pressure = int((data_in['pressure']+data_out['pressure'])/2)
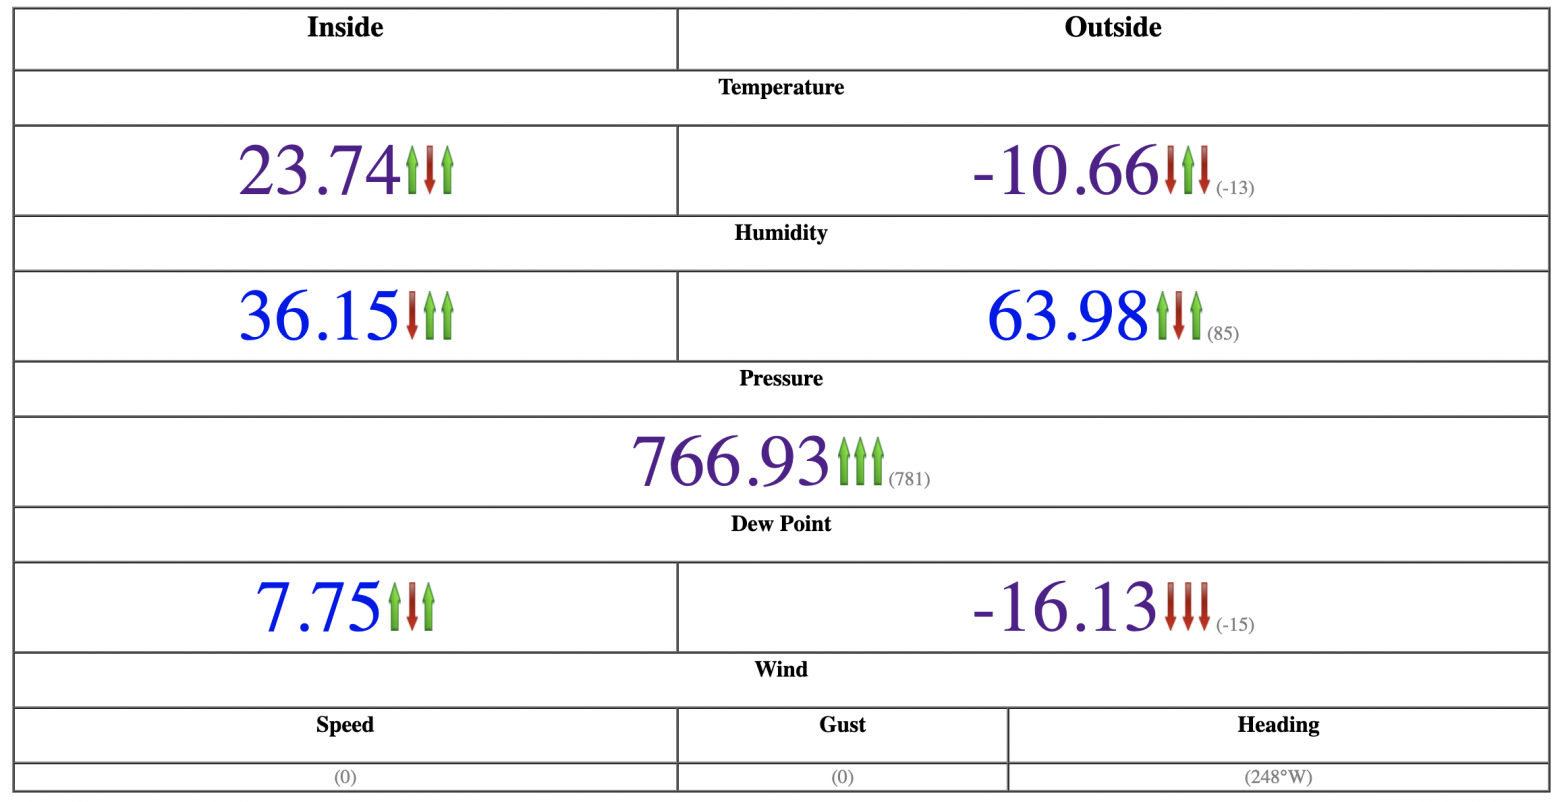
formatted_string = f"IN: T={data_in['temperature']}*C, " \
f"H={data_in['humidity']}% | " \
f"OUT: T={data_out['temperature']}*C, " \
f"H={data_out['humidity']}%, " \
f"DP={data_out['dew_point']}*C | " \
f"P={pressure} mmhg"
return formatted_string
Radio Sensors
Where Wi-Fi coverage ends and dragons dwell, alternative data transmission methods come into play. In my case — LoRa modules (paired with, say, an Arduino Nano).
I’ve got two such contraptions: one is a wind speed and direction sensor (with a compass thrown in for good measure). I’ll skip the juicy details on that one for now — maybe I’ll write a separate rant if there’s demand.
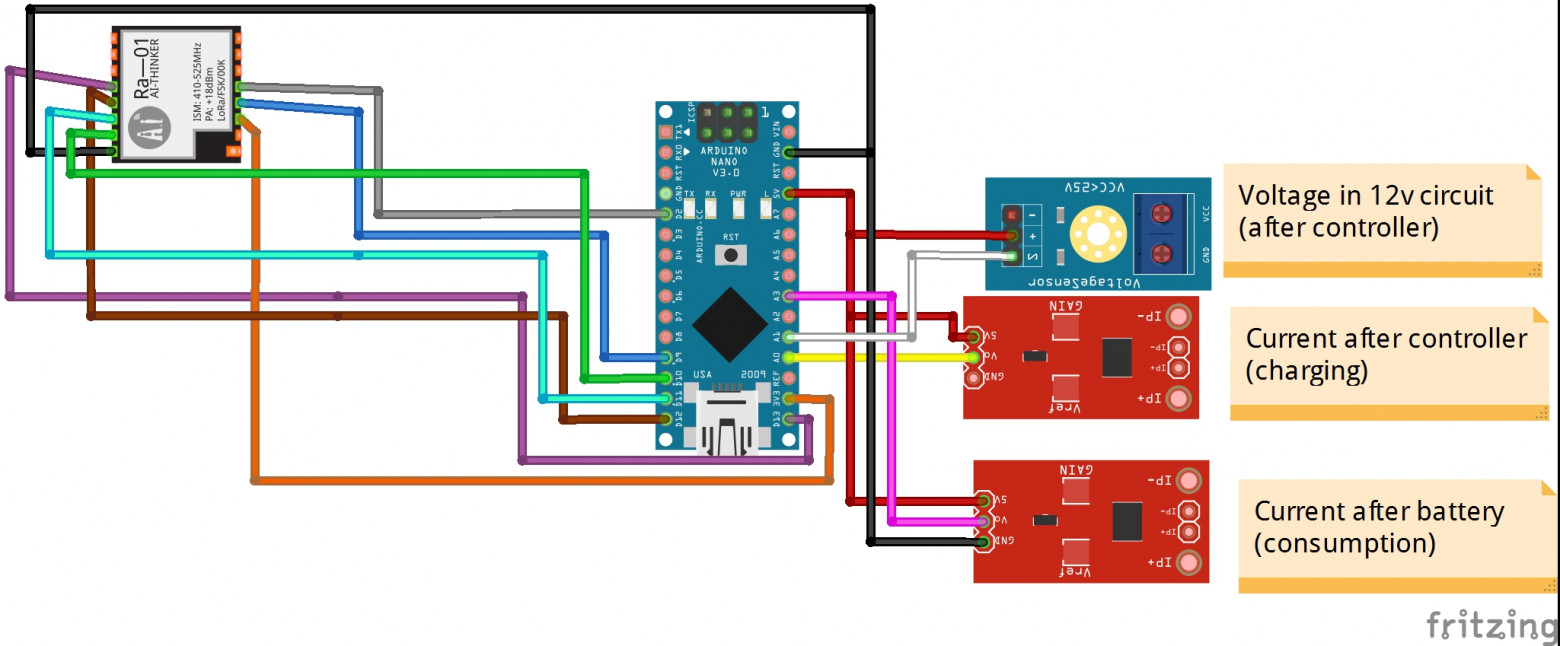
The second device is a voltmeter plus two ammeters — used to monitor turbine performance, battery charging, and load consumption. Because just looking at spinning blades isn’t geeky enough.
Hardware Wiring: SX1278 + Arduino Nano
| SX1278 | Arduino Nano |
|---|---|
| 3.3V | 3.3V |
| GROUND | GROUND |
| MOSI | D10 |
| MISO | D11 |
| SCK | D13 |
| NSS / ENABLE | D12 |
| DIO0 | D2 |
| RST | D9 |
And the code, naturally, lives here:
iot/arduino/*_meter/*_meter.ino
// Required includes
#include <SPI.h>
#include <LoRa.h>

// LoRA config
const int LORA_SEND_RETRIES = 5; // сколько раз посылать сообщение
const int LORA_SEND_DELAY = 20;  // задержка между пакетами
const int LORA_POWER = 20;       // мощность передатчика на максимум
const int LORA_RETRIES = 12;     // сколько раз пытаться инициализировать модуль
const int LORA_DELAY = 500;      // задержка между попыткой инициализации


// Инициализируем модуль
void init_LoRa()
{
    bool success = false;
    for (int i=0; i < LORA_RETRIES; i++)

    {
        if (LoRa.begin(433E6)) // используем 433Мгц
        {
            success = true;
            break;
        }
        delay(LORA_DELAY);
    }
    if (!success)
    {
        #ifdef DEBUG
        Serial.println("LoRa init failed.");
        #endif
        stop(4);
    }

    LoRa.setTxPower(LORA_POWER);  // aplify TX power
    #ifdef DEBUG
    Serial.println("LoRa started!");
    #endif
}
#endif

// Посылаем пакет с данными строкой
void LoRa_send(power_data data)
{
    String packet = DEVICE_ID + "," + String(data.avg_voltage,2) + ",";
    packet += String(data.avg_current,2) + "," + String(data.avg_power,2) + "," +String(data.avg_consumption,2);
    for (int i=0; i < LORA_SEND_RETRIES; i++)
    {
        LoRa.beginPacket();  // just open packet
        LoRa.print(packet);  // send whole data
        LoRa.endPacket();    // end packet
        delay(LORA_SEND_DELAY);
    }
}
Pretty straightforward, right?
Cloud Services
Originally, I didn’t plan on sharing data with third-party cloud services — this was meant to be a private, cold, geeky fortress of solitude. But during debugging, I thought: “Hey, it’d be nice to compare my numbers with local weather stations, just to make sure my sensors aren’t lying.”
The first candidate — and by far the one with the most sample code and API documentation — was WeatherUnderground.
from wunderground_pws import WUndergroundAPI, units

from secure_data import wu_api_key, wu_reference_station_id

""" ... """

wu_current = wu.current()

""" ... """

wu_humidity=wu_current['observations'][0]['humidity'],
wu_pressure=int(int(wu_current['observations'][0]['metric_si']['pressure'])/1.33),
wu_dew_point=wu_current['observations'][0]['metric_si']['dewpt'],
wu_wind_speed=wu_current['observations'][0]['metric_si']['windSpeed'],
wu_wind_gust=wu_current['observations'][0]['metric_si']['windGust'],
wu_wind_direction=wu_current['observations'][0]['winddir'],
wu_wind_heading=deg_to_heading(int(wu_current['observations'][0]['winddir']))
Then, of course, the old lightbulb went off: “If I’m already pulling this data, why not share mine too?” It’s not like I’m measuring nuclear secrets.
WU accepts data via a simple GET request. So we prep the payload accordingly…
def prepare_wu_format(data, timestamp=None):
    payload = f"&dateutc={timestamp}" if timestamp else "&dateutc=now"
    payload += "&action=updateraw"
    payload += "&humidity=" + "{0:.2f}".format(data['humidity'])
    payload += "&tempf=" + str(celsius_to_fahrenheit(data['temperature']))
    payload += "&baromin=" + str(mmhg_to_baromin(data['pressure']))
    payload += "&dewptf=" + str(celsius_to_fahrenheit(data['dew_point']))
    payload += "&heatindex=" + str(celsius_to_fahrenheit(heat_index(temp=data['temperature'], hum=data['humidity'])))
    payload += "&humidex=" + str(celsius_to_fahrenheit(humidex(t=data['temperature'], d=data['dew_point'])))
    payload += "&precip=" + str(data['precip'])
    payload += "&uv" + str(data['uv'])
    return payload
...and fire it off. Voilà — data appears on our personal weather station dashboard.
import requests

""" ... """

def send_data_to_wu(data):
    wu_url = "https://weatherstation.wunderground.com/weatherstation/updateweatherstation.php?"
    wu_creds = "ID=" + wu_station_id + "&PASSWORD=" + wu_station_pwd
    response = requests.get(f'{wu_url}{wu_creds}{data}')
    return response.content
As result, we get a nice little dashboard with our data, plus a few extra features like photo uploads and historical data.
Important caveat: All these services (WU included) demand registration and usually an API key. All sensitive stuff (logins, tokens, etc.) goes into secure_data.py — because we’re professionals here, not cavemen.
# Geo Data
latitude =
longitude =
altitude =
cur_location =

# WEATHER UNDERGROUND DATA
wu_api_key =
wu_station_id =
wu_station_pwd =
wu_reference_station_id =

# OPEN WEATHER DATA
ow_api_key =
ow_station_id =

# PWSWEATHER DATA
pwsw_station_id =
pwsw_api_key =

# NARODMON DATA
narodmon_name =
narodmon_owner =
narodmon_mac =
narodmon_api_key =
Fill in the blanks and off we go :)
Sadly, WeatherUnderground went full capitalist, and the API key I received is only valid for one year unless you pony up. So I looked for alternatives — and found PWS Weather.
PWS Weather
Despite lacking any official public API docs for non-industrial devices, the devs are friendly and quick to send examples by request. That said, I cracked it on my own overnight. Their API format is blissfully identical to WU’s.
def send_data_to_pwsw(data):
    pwsw_url = "http://www.pwsweather.com/pwsupdate/pwsupdate.php?"
    pwsw_creds = "ID=" + pwsw_station_id + "&PASSWORD=" + pwsw_api_key
    response = requests.get(f'{pwsw_url}{pwsw_creds}{data}')
    return response.content
Honestly, I liked this service more.
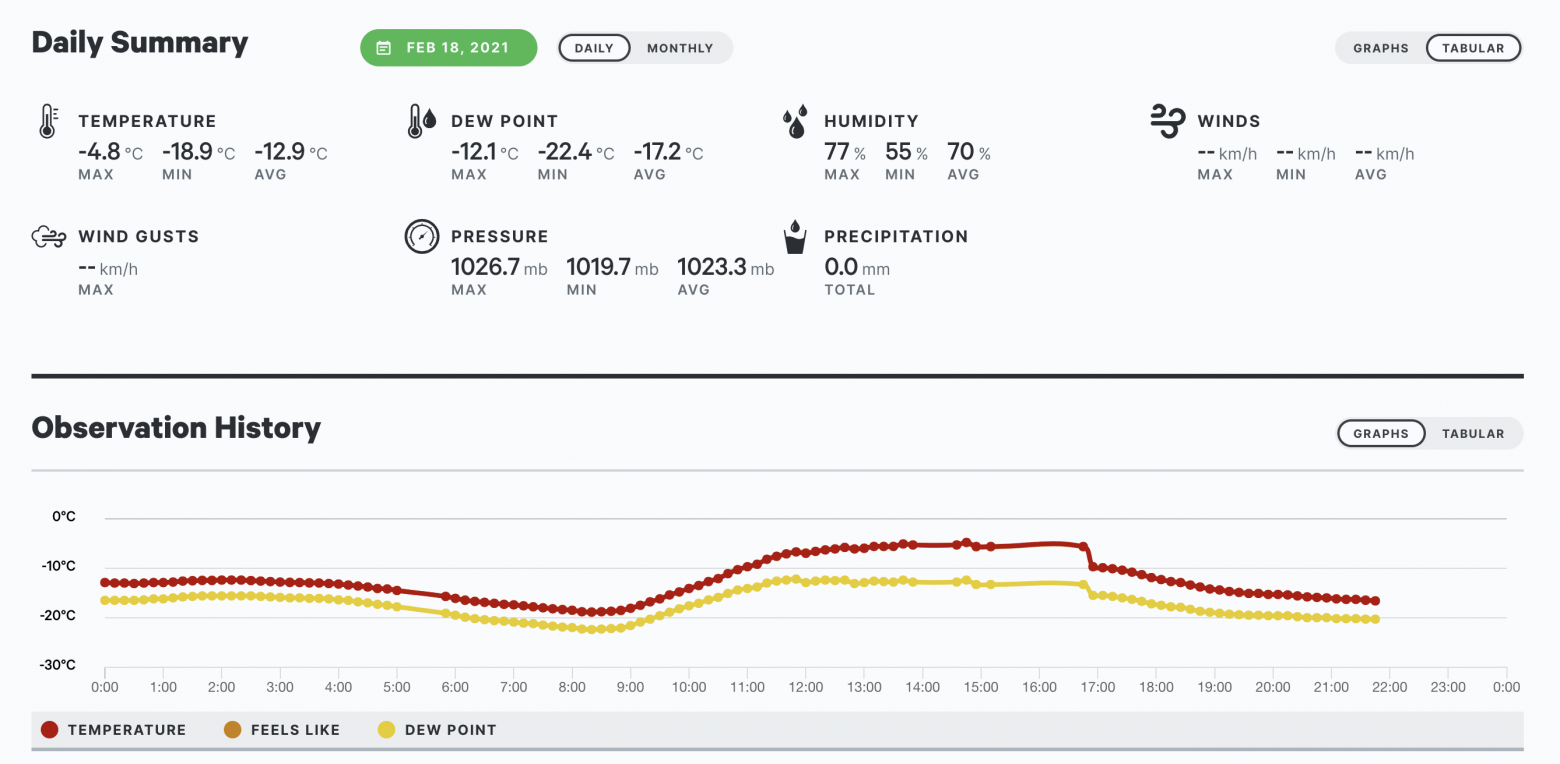
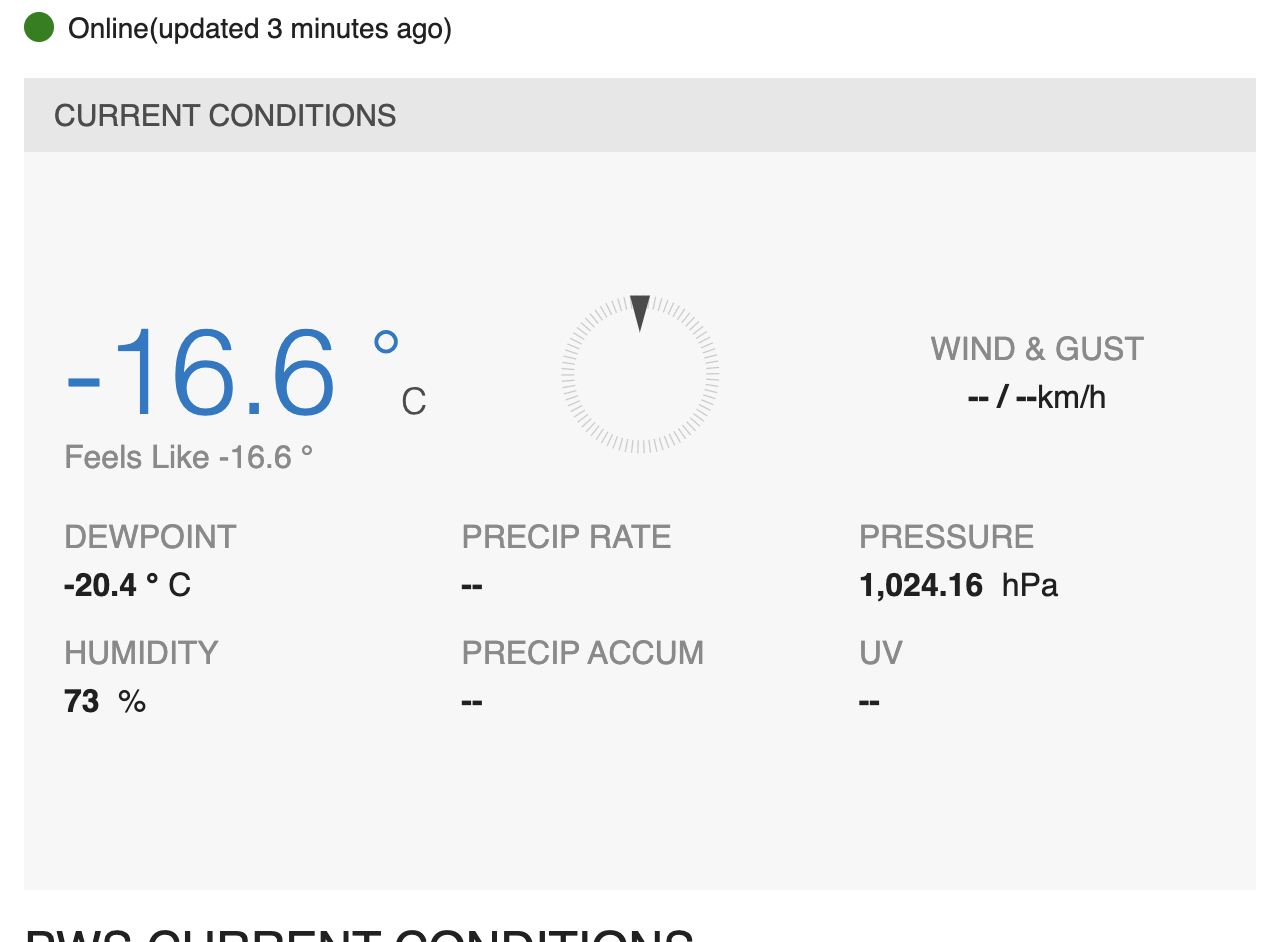
It has a lovely switch between imperial and metric systems (the latter being blessed by the gods of SI units), pretty charts, and reasonably good forecasts.
OpenWeatherMap
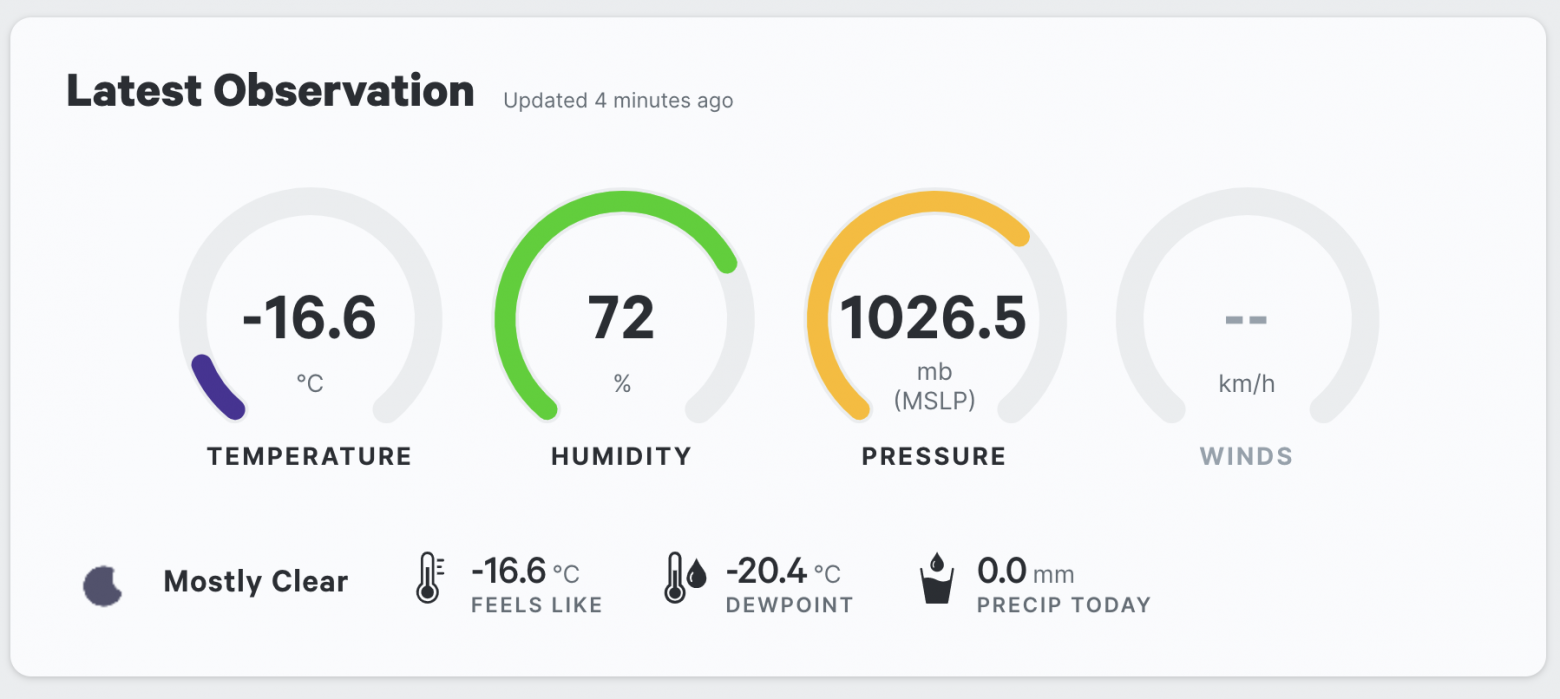
You can also push data to OpenWeatherMap. It won’t give you a snazzy personal dashboard, and the historical data comes as averages, but hey — supporting open data is noble, right?
OWM has its own OpenWeatherMap API for PWS (Personal Weather Station), but — surprise — I didn’t find a Python wrapper for it. So I wrote my own - openweather-pws. Again.
Unlike the American services clinging to Fahrenheit and feet, the folks behind OWM are from Latvia and speak fluent metric. So no need to run our numbers through a unit converter — just pipe them straight from our sensor database.
Narodmon: The Local Hero
And then there’s Narodmon — a Russian-made alternative that supports even “secret” data (like indoor temperature, or how hot your Raspberry Pi is getting from doing all this nonsense).
def send_data_to_nardmon(data):
    nm = Narodmon(mac=narodmon_mac, name=narodmon_name, owner=narodmon_owner,
                  lat=latitude, lon=longitude, alt=altitude)
    temperature = nm.via_json.prepare_sensor_data(id_in="TEMPC", value=data['temperature'])
    pressure = nm.via_json.prepare_sensor_data(id_in="MMHG", value=(data['pressure']))
    humidity = nm.via_json.prepare_sensor_data(id_in="HUM", value=data['humidity'])
    dew_point = nm.via_json.prepare_sensor_data(id_in="DEW", value=data['dew_point'])
    sensors = [temperature, pressure, humidity, dew_point]
    response = nm.via_json.send_short_data(sensors=sensors)
    return response
It has one odd quirk: You’re not allowed to send data more than once every five minutes. In practice, that seems to mean “once every 10 to 15 minutes” — either their server is slow or we live in different time zones. Either way, if you set everything up correctly, your data will show up.
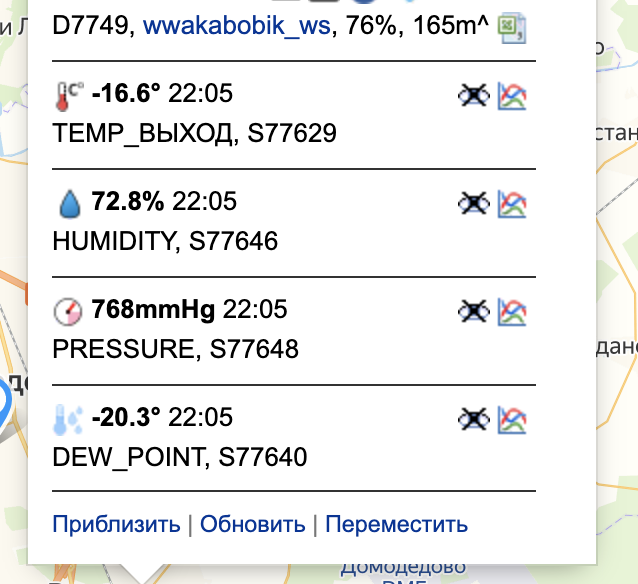
Their API is quite rich: you can send sensor data, fetch nearby readings, manage devices remotely, or even do social things like “like” a weather station or send it a message. Plus, it’ll email you if a sensor goes AWOL for an hour — or if a threshold is crossed. But — you guessed it — no Python wrapper here either. So, guess what? I wrote another one - narodmon-python-api.
To send data, you just poke /api/v1/send_data with an empty GET request. Cron job to the rescue:
*/5 * * * * /usr/bin/wget -O - -q -t 1 http://0.0.0.0:80/api/v1/send_data
WeatherUnderground Photo Upload
Still a work in progress. Photos can be sent to WeatherUnderground via FTP — and it’s not even hard. It just... hasn’t happened yet.
from ftplib import FTP

def send_image_to_wu(image):
    session = FTP('webcam.wunderground.com', wu_cam_id, wu_cam_pwd)
    file = open(image, 'rb')
    session.storbinary('image.jpg', file)
    file.close()
    session.quit()
To this day, I’ve never successfully uploaded even a single photo to WU. According to their forums, this feature is temperamental at best and dead at worst.
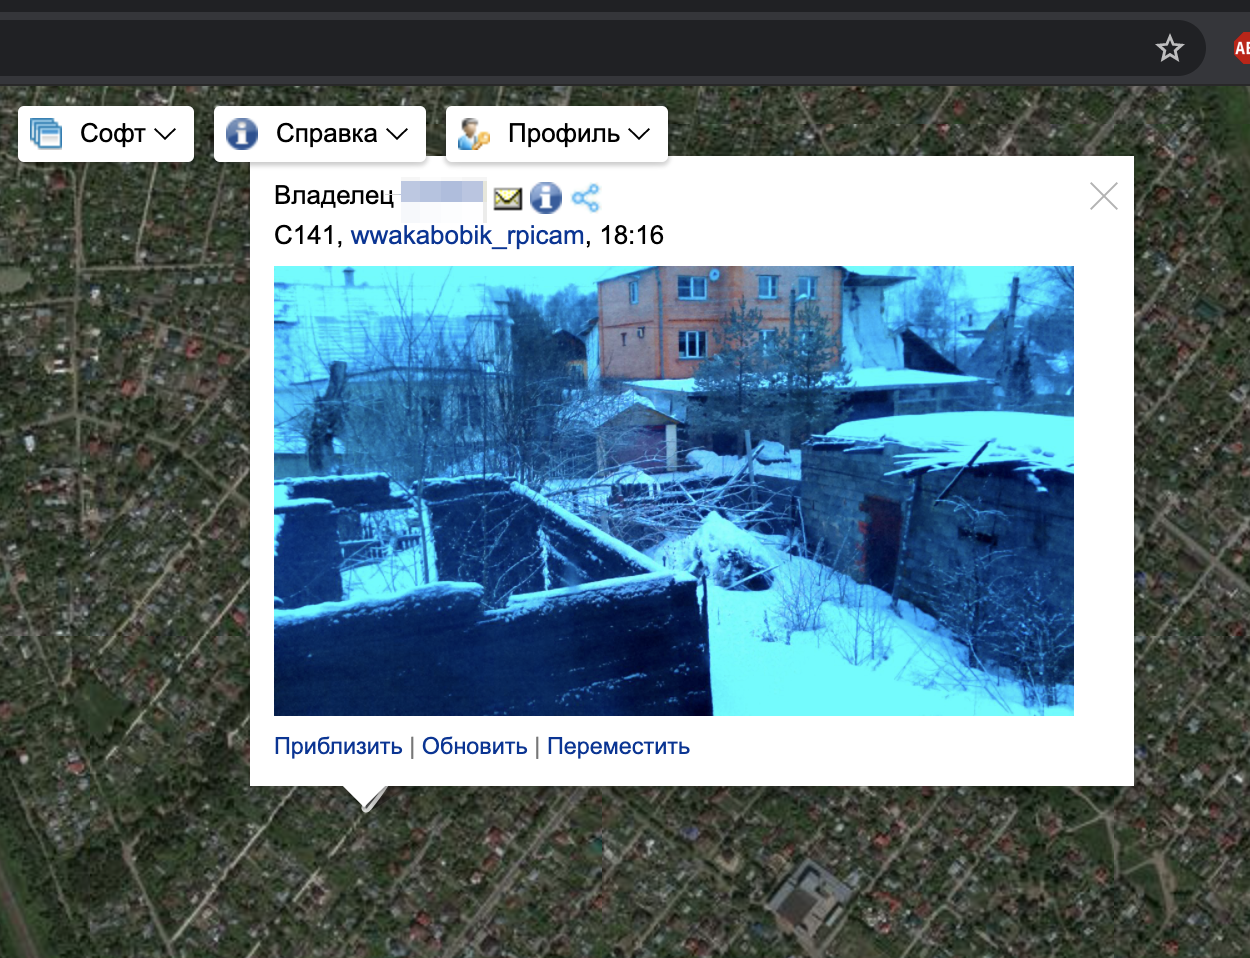
Narodmon, on the other hand, accepts image uploads with a quick call to /api/v1/capture_photo (which triggers take_photo). Let’s say we call this every 30 minutes via cron, like so:
#!/bin/bash

PATH_TO_PHOTO=`/usr/bin/wget -O - -q -t 1 http://0.0.0.0/api/v1/capture_photo`
REQUEST='curl -F YOUR_CAM_KEY=@'$PATH_TO_PHOTO' http://narodmon.ru/post'
RESULT=`$REQUEST` >/dev/null 2>&1
Boom — the image appears on the service dashboard.
Don’t forget to occasionally clean up old photos — say, once a week:
#!/bin/bash bash

# Notes:
# This file will remove all files in camera folder older than 7 days, just run in via cron periodically (i.e. daily).
find /home/pi/web-server/camera/ -type f -mtime +7 -name '*.jpg' -execdir rm -- '{}' \;
What’s Next?
The plan is to bring the whole setup into shape — build a proper Stevenson screen once the snow melts, and hoist the wind sensor to a respectable height come spring.
The software? Oh, it’s definitely going to need some polishing along the way. Eventually, I want the station to do things — like regulate heating, or engage/disengage wind power generator.
If you like my article, feel free to throw a coin. And, for sure here are link to the GitHub repo with all code.
May your backups be many and your data loss few. Until next time, I bid thee safe coding and DYI!